চিত্র:High plains fresh groundwater usage 2000.svg

মূল ফাইল (এসভিজি ফাইল, সাধারণত ৭৪৭ × ৯৪৬ পিক্সেল, ফাইলের আকার: ১.৪৮ মেগাবাইট)

সারাংশ
| বিবরণHigh plains fresh groundwater usage 2000.svg |
English: This map shows the estimated fresh water usage per square mile in the year 2000 for counties in the eight states underlain in part by the High Plains (Ogallala) Aquifer, presented as million gallons per square mile and million liters per square kilometer.
Usage is for all purposes -- public supply, industrial, irrigation, mining, livestock, and thermoelectric power -- from all underground sources, not just from the Ogallala Aquifer. Water usage data for the year 2000 was taken from the datafile wu2000t.dbf[1] from the US National Atlas[2]. Citation information from the metadata for that file:
Additionally:
The attribute used in this map is described:
The data is supplied as million gallons per day, by county. To arrive at an annual amount per square mile per year, the usage value from wu2000t.dbf was multiplied by 365 and divided by the number of square miles in the county as given in the 2000 county shapefile co2000p020 from the National Atlas:
Aquifer boundaries taken from Fischer and McGuire[3]. The map is presented in a Lambert azimuthal equal-area projection as used in the National Atlas (EPSG:2163[4]), the central meridian and latitude of which align nicely with the aquifer. |
| তারিখ | |
| উৎস | নিজের কাজ |
| লেখক | Kbh3rd |
| অন্যান্য সংস্করণ | File:Ogallala area freshwater ground withdrawals all aquifers.png |

লাইসেন্স প্রদান


- আপনি স্বাধীনভাবে:
- বণ্টন করতে পারেন – এ কাজটি অনুলিপি, বিতরণ এবং প্রেরণ করতে পারেন
- পুনঃমিশ্রণ করতে পারেন – কাজটি অভিযোজন করতে পারেন
- নিম্নের শর্তাবলীর ভিত্তিতে:
- স্বীকৃতিপ্রদান – আপনাকে অবশ্যই যথাযথ স্বীকৃতি প্রদান করতে হবে, লাইসেন্সের একটি লিঙ্ক সরবরাহ করতে হবে এবং কোনো পরিবর্তন হয়েছে কিনা তা নির্দেশ করতে হবে। আপনি যেকোনো যুক্তিসঙ্গত পদ্ধতিতে এটি করতে পারেন। কিন্তু এমন ভাবে নয়, যাতে প্রকাশ পায় যে লাইসেন্সধারী আপনাকে বা আপনার এই ব্যবহারের জন্য অনুমোদন দিয়েছে।
- একইভাবে বণ্টন – আপনি যদি কাজটি পুনঃমিশ্রণ, রুপান্তর, বা এর ওপর ভিত্তি করে নতুন সৃষ্টিকর্ম তৈরি করেন, তবে আপনাকে অবশ্যই আপনার অবদান একই লাইসেন্স বা একই রকমের লাইসেন্সের আওতায় বিতরণ করতে হবে।
ক্যাপশন
ফাইলের ইতিহাস
যেকোনো তারিখ/সময়ে ক্লিক করে দেখুন ফাইলটি তখন কী অবস্থায় ছিল।
| তারিখ/সময় | সংক্ষেপচিত্র | মাত্রা | ব্যবহারকারী | মন্তব্য | |
|---|---|---|---|---|---|
| বর্তমান | ০৪:৪৩, ১০ মার্চ ২০০৯ | 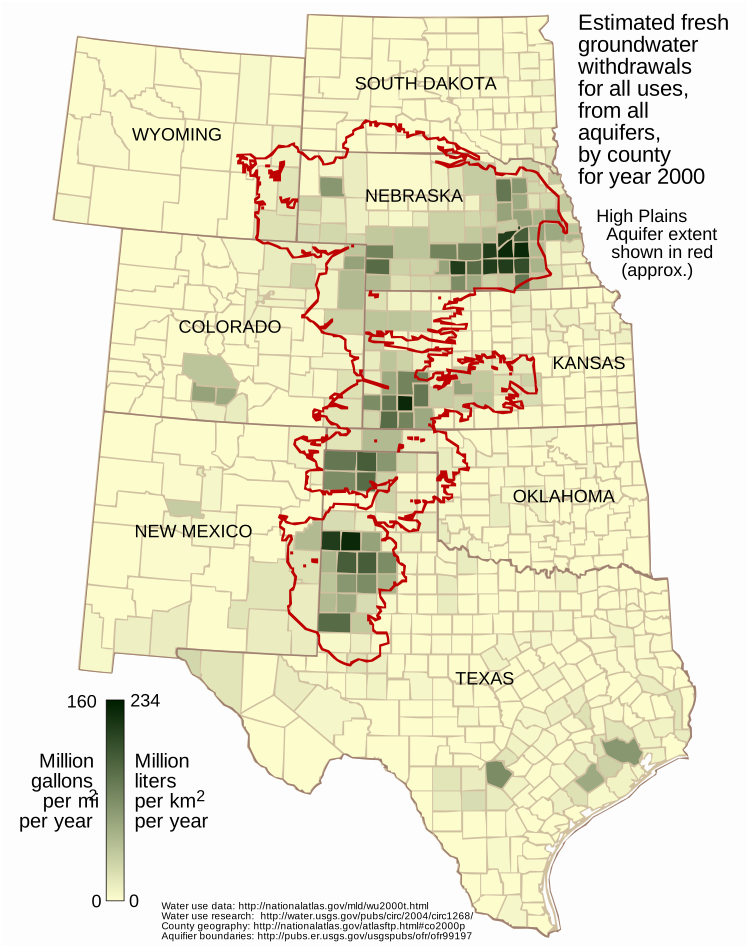 | ৭৪৭ × ৯৪৬ (১.৪৮ মেগাবাইট) | smartcommons>Kbh3rd | corrected metric conversion - see talk |
ফাইলের ব্যবহার
এই ফাইল ব্যবহার করে এমন কোনো পাতা নেই।
