চিত্র:Mahela Jayawardene graph.png

এই প্রাকদর্শনের আকার: ২২০ × ১২৮ পিক্সেল। অন্যান্য আকারসমূহ: ৩২০ × ১৮৬ পিক্সেল | ৯৮৬ × ৫৭৪ পিক্সেল।
মূল ফাইল (৯৮৬ × ৫৭৪ পিক্সেল, ফাইলের আকার: ৬ কিলোবাইট, এমআইএমই ধরন: image/png)

সারাংশ
| বিবরণMahela Jayawardene graph.png |
English: This graph details the Test Match performance of Mahela Jayawardene. It was created by Raven4x4x. The red bars indicate the player's test match innings, while the blue line shows the average of the ten most recent innings at that point. Note that this average cannot be calculated for the first nine innings. The blue dots indicate innings in which Jayawardene finished not-out.
This graph was generated with Microsoft Excel 2002, using data from Cricinfo [1] and Howstat [2]. The information in this chart is current as of 28 January 2008. |
| তারিখ | ২৮ জানুয়ারি ২০০৮ (মূল আপলোডের তারিখ) |
| উৎস |
নিজের কাজ Transferred from en.wikipedia |
| লেখক | Raven4x4x at en.wikipedia |
লাইসেন্স প্রদান
| Public domainPublic domainfalsefalse |

|
এই কাজের প্রণেতা Raven4x4x ইংরেজি উইকিমিডিয়া কমন্স প্রকল্পের কাজটি পাবলিক ডোমেইনে প্রকাশ করেছেন। এটি বিশ্বব্যাপী প্রযোজ্য হবে। যে ক্ষেত্রে এটি আইনত সম্ভব নয়: |
মূল আপলোড লগ
মূল বিবরণ পাতাটি এখানে ছিল। নিম্নলিখিত সকল ব্যবহারকারীর নাম en.wikipedia-এ উল্লেখ করা ছিল।

- 2008-01-28 00:28 Raven4x4x 986×574 (5793 bytes) This graph details the [[Test cricket|Test Match]] performance of [[Mahela Jayawardene]]. It was created by [[User:Raven4x4x|Raven4x4x]]. The red bars indicate the player's test match innings, while the blue line shows the [[Batting average|average]] of t
ক্যাপশন
এই ফাইলটি কী উপস্থাপন করছে তার এক লাইন ব্যাখ্যা যোগ করুন
ফাইলের ইতিহাস
যেকোনো তারিখ/সময়ে ক্লিক করে দেখুন ফাইলটি তখন কী অবস্থায় ছিল।
| তারিখ/সময় | সংক্ষেপচিত্র | মাত্রা | ব্যবহারকারী | মন্তব্য | |
|---|---|---|---|---|---|
| বর্তমান | ০৪:১৯, ২৮ জুলাই ২০১০ | 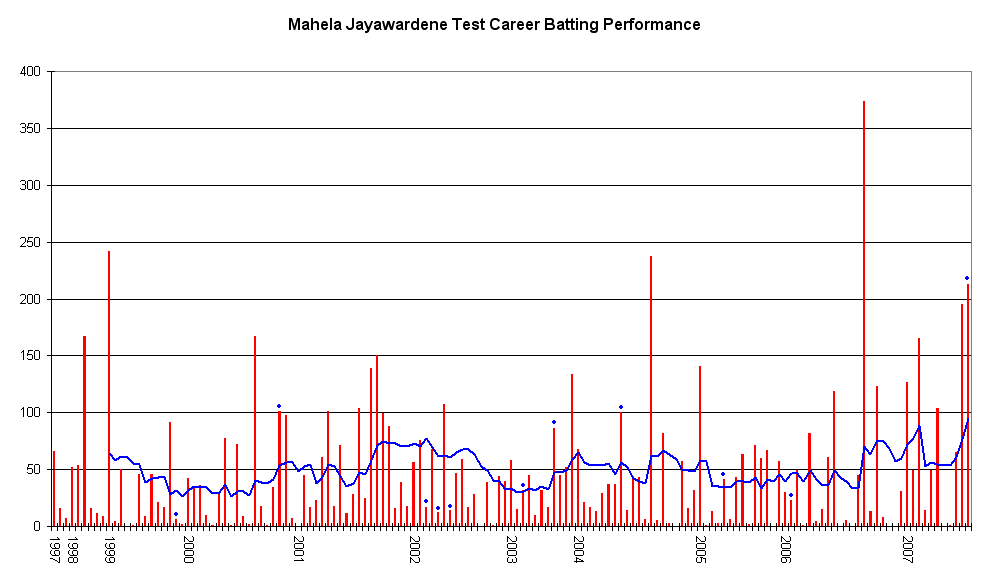 | ৯৮৬ × ৫৭৪ (৬ কিলোবাইট) | smartcommons>MGA73bot2 | == {{int:filedesc}} == {{Information |description={{en|1=This graph details the Test Match performance of Mahela Jayawardene. It was created by Raven4x4x. The red bars indicate the pla |
ফাইলের ব্যবহার
এই ফাইল ব্যবহার করে এমন কোনো পাতা নেই।
