চিত্র:Rahul Dravid Test batting graph 10 innings average.svg

এই SVG ফাইলের জন্য এই PNG প্রাকদর্শনের আকার: ২২০ × ১০২ পিক্সেল। অন্যান্য আকার: ৩২০ × ১৪৯ পিক্সেল।
মূল ফাইল (এসভিজি ফাইল, সাধারণত ৫,৯৩৮ × ২,৭৬০ পিক্সেল, ফাইলের আকার: ২৭ কিলোবাইট)
সারাংশ
| বিবরণRahul Dravid Test batting graph 10 innings average.svg |
English: This graph details the Test cricket performance of Rahul Dravid. The bars show the runs scored in each innings (purple bars indicate not out). The blue line shows the batting average of the 10 most recent innings at that point (cannot be calculated for first 9 innings). Source: this data from howstat.com.au.
This graph has been created with this PHP script, with the following request URL (using localhost): http://127.0.0.1/battinggraph.php?id=2060&format=test&name=Rahul+Dravid&avg=10&max=300&scale=8&legend=1&legendmaxsize=3000&intervals=6&barwidth=12&barspacing=8&fontsize=45&barstyle=fill%3A%23ff0000%3B+fill-opacity%3A1%3B+stroke%3Anone¬outstyle=fill%3A%23ec36ff%3B+fill-opacity%3A1%3B+stroke%3Anone&avgstyle=fill%3Anone%3B+stroke%3A%230000ff%3B+stroke-width%3A6%3B+stroke-opacity%3A1&yearlabels=1 |
| তারিখ | |
| উৎস | নিজের কাজ |
| লেখক | Jfd34 |
| SVG genesis InfoField |  এই লেখচিত্রটি একটি অজানা SVG সরঞ্জাম দিয়ে তৈরি করা হয়েছে। এই লেখচিত্রটি একটি অজানা SVG সরঞ্জাম দিয়ে তৈরি করা হয়েছে। |


লাইসেন্স প্রদান
আমি, এই কাজের স্বত্বাধিকারী, এতদ্দ্বারা আমি এই কাজকে নিম্ন বর্ণিত লাইসেন্সের আওতায় প্রকাশ করলাম:


এই ফাইলটি ক্রিয়েটিভ কমন্স অ্যাট্রিবিউশন ৩.০ আনপোর্টেড লাইসেন্সের আওতায় লাইসেন্সকৃত।
- আপনি স্বাধীনভাবে:
- বণ্টন করতে পারেন – এ কাজটি অনুলিপি, বিতরণ এবং প্রেরণ করতে পারেন
- পুনঃমিশ্রণ করতে পারেন – কাজটি অভিযোজন করতে পারেন
- নিম্নের শর্তাবলীর ভিত্তিতে:
- স্বীকৃতিপ্রদান – আপনাকে অবশ্যই যথাযথ স্বীকৃতি প্রদান করতে হবে, লাইসেন্সের একটি লিঙ্ক সরবরাহ করতে হবে এবং কোনো পরিবর্তন হয়েছে কিনা তা নির্দেশ করতে হবে। আপনি যেকোনো যুক্তিসঙ্গত পদ্ধতিতে এটি করতে পারেন। কিন্তু এমন ভাবে নয়, যাতে প্রকাশ পায় যে লাইসেন্সধারী আপনাকে বা আপনার এই ব্যবহারের জন্য অনুমোদন দিয়েছে।
ক্যাপশন
এই ফাইলটি কী উপস্থাপন করছে তার এক লাইন ব্যাখ্যা যোগ করুন
ফাইলের ইতিহাস
যেকোনো তারিখ/সময়ে ক্লিক করে দেখুন ফাইলটি তখন কী অবস্থায় ছিল।
| তারিখ/সময় | সংক্ষেপচিত্র | মাত্রা | ব্যবহারকারী | মন্তব্য | |
|---|---|---|---|---|---|
| বর্তমান | ২২:৩৬, ২ জানুয়ারি ২০১৩ | 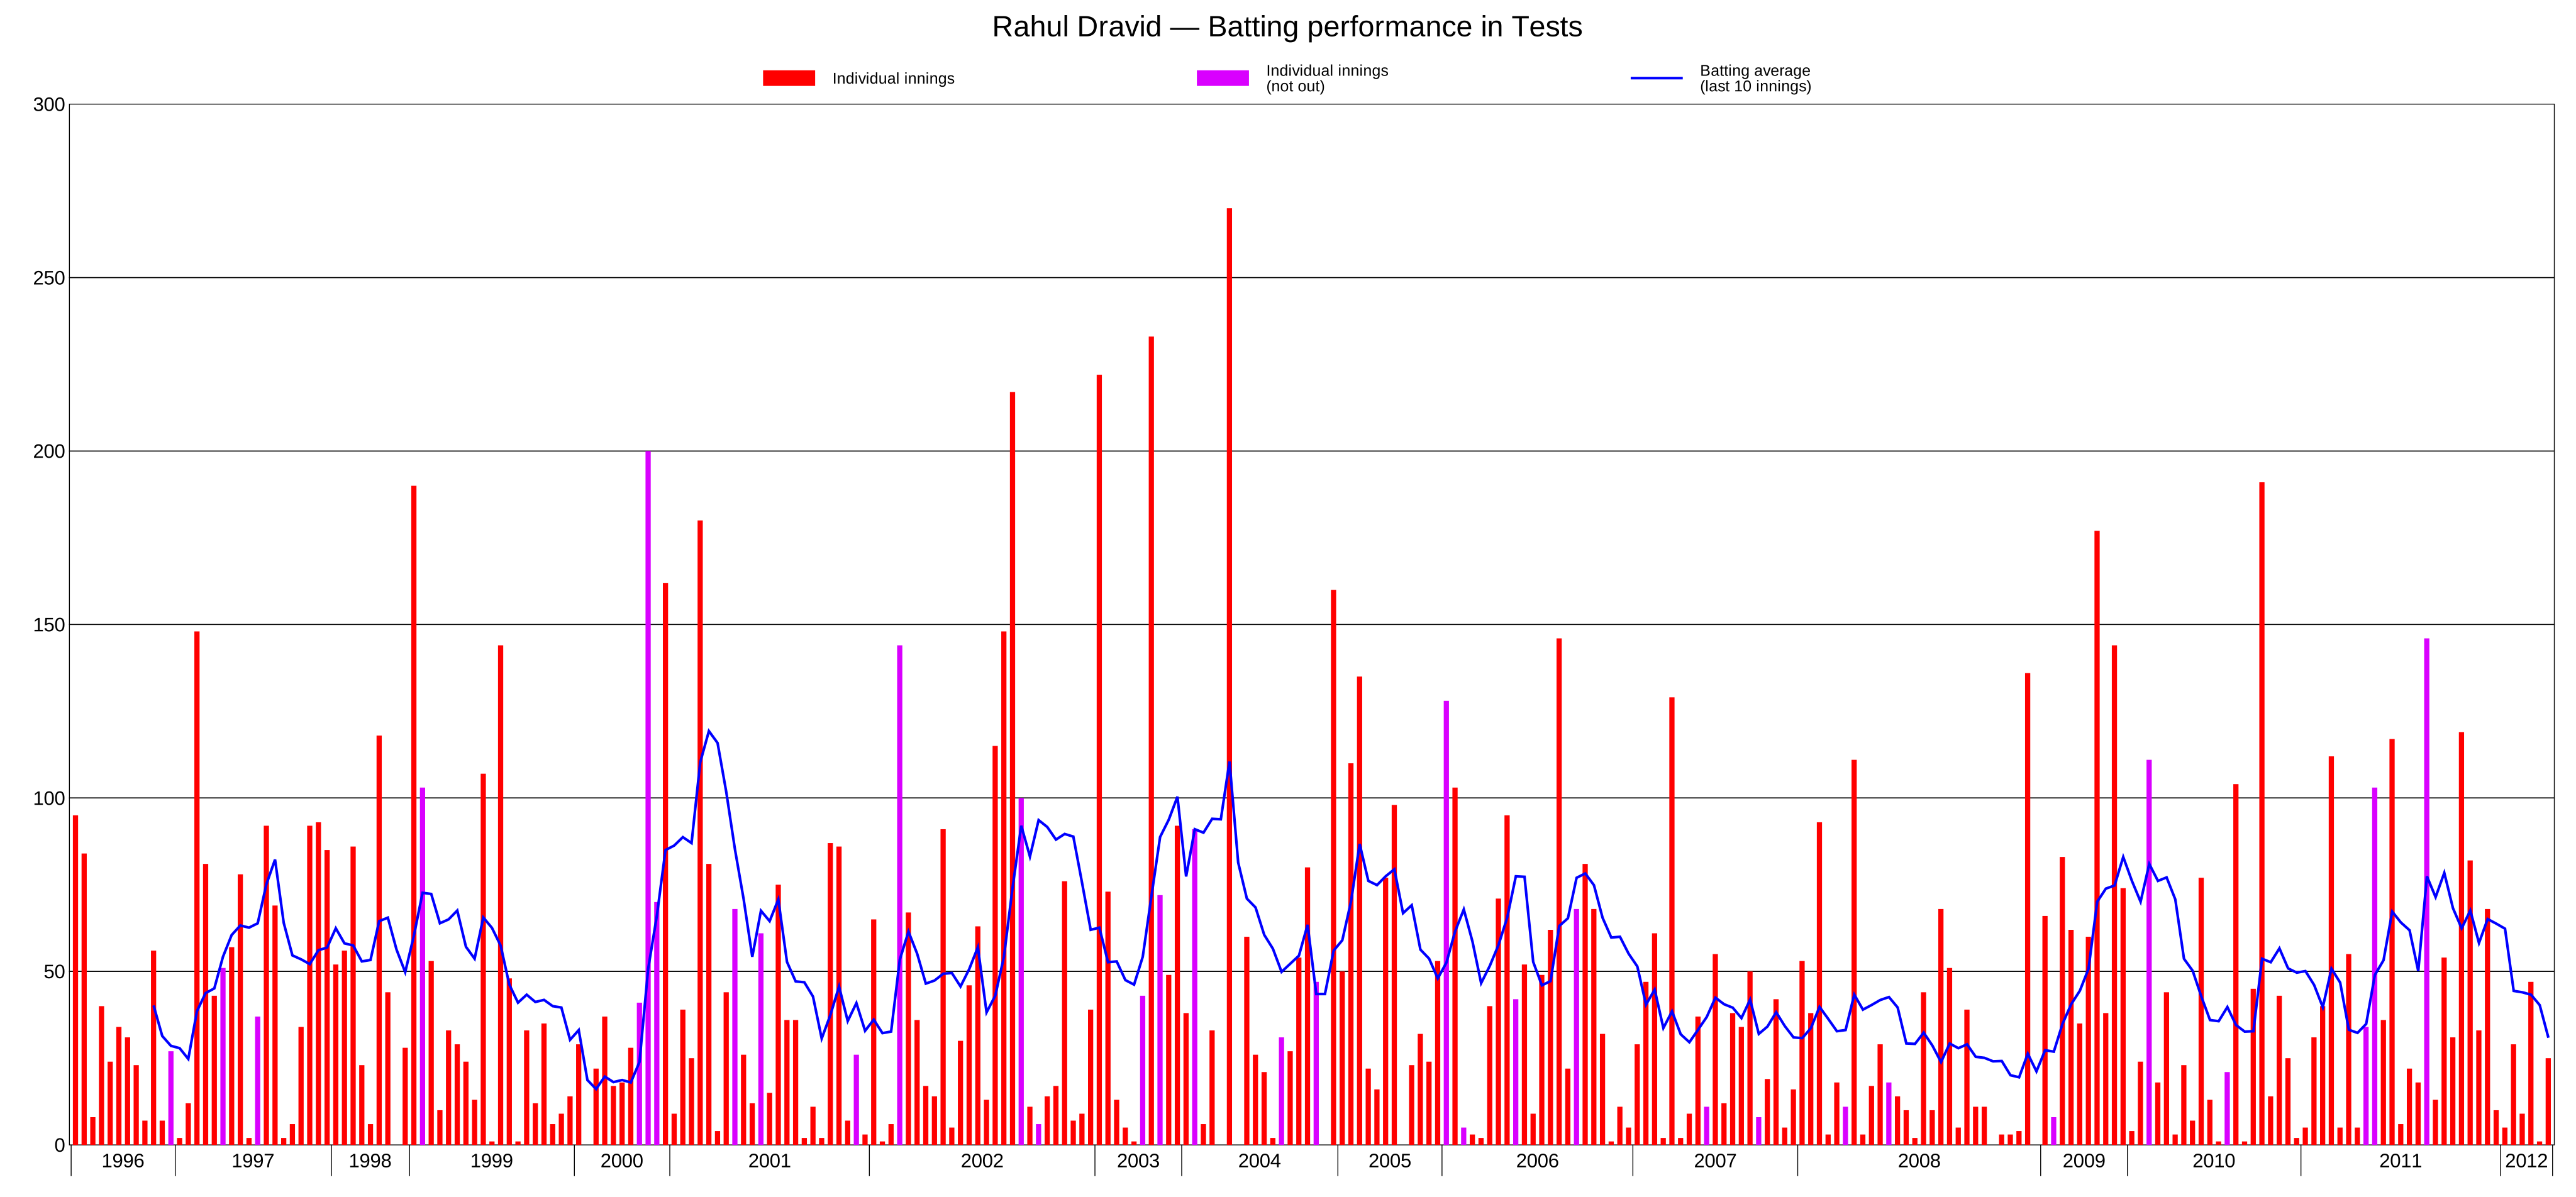 | ৫,৯৩৮ × ২,৭৬০ (২৭ কিলোবাইট) | smartcommons>Jfd34 | User created page with UploadWizard |
ফাইলের ব্যবহার
এই ফাইল ব্যবহার করে এমন কোনো পাতা নেই।
